Différences entre les versions de « Characterisation zone »
(Création de la page) |
(ajout du lien vers la page cible à partir du drapeau) |
||
| Ligne 1 : | Ligne 1 : | ||
| − | [[Fichier:Flag_fr.png|40px|left|Zone caractérisation]] | + | [[Fichier:Flag_fr.png|40px|left|Zone caractérisation|link=http://plateforme.icube.unistra.fr/c3fab/index.php/Zone_caract%C3%A9risation]] |
[[Zone caractérisation]] | [[Zone caractérisation]] | ||
| − | <br/><br/> | + | <br/><br/><br/> |
<table border="0" cellpadding="5" cellspacing="1" style="width:100%;"> | <table border="0" cellpadding="5" cellspacing="1" style="width:100%;"> | ||
<tr><td width="30%">[[Image:BoiteZoneCaracRed.jpg|left|Characterisation zone]]</td> | <tr><td width="30%">[[Image:BoiteZoneCaracRed.jpg|left|Characterisation zone]]</td> | ||
| − | <td><p><strong>Contact | + | <td><p><strong>Contact:</strong> [[Personnel|Sadiara FALL]]</p></td></tr></table> |
<br/> | <br/> | ||
Version du 3 janvier 2017 à 15:51
 |
Contact: Sadiara FALL |
In organic photovoltaic cells the active layer is made of a blend of materials donor and acceptor of electrons sandwiched between the anode and the cathode. Different devices may be distinguished depending on whether the cell is illuminated from the anode or from the cathode:
|
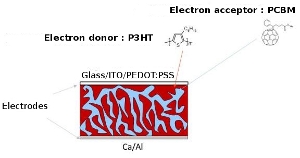 |
Evaporation masks used for the different characterisations carried out in the laboratory allow to realise cells with four diodes of 12 mm2 or two diodes of 24 mm2 on each glass substrate. For particular needs, other device architectures and other electrodes sizes can be considered (requests can simply be sent by e-mail).
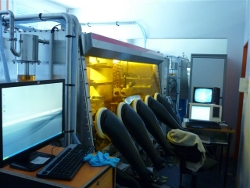
The characterisation of organic photovoltaic cells is performed in the dedicated zone of one of the glove boxes systems by means of the methods described below.
Measurement of the electrical characteristics under solar simulator
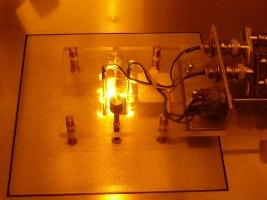
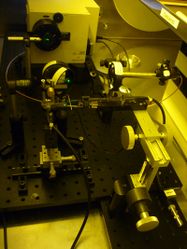
The electrical characteristics of organic photovoltaic cells are evaluated from the measurement of the variation of the current according to the applied voltage, at first in a mode called "in the dark", which means that the cell is not illuminated, then in the mode "under illumination", that is while the cell is illuminated by a solar simulator (Fig. 1).
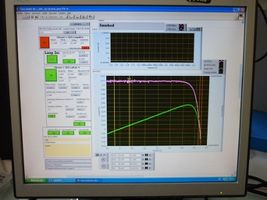
A software developed in house (Fig. 2) extracts, from the characteristics I(V) measured in both modes (Fig. 3), the various photovoltaic parameters of the cells: the open circuit voltage Voc, the short circuit current density Jsc, the fill factor FF and the power conversion efficiency PCE.
The solar simulator is a class AAA AM1.5G simulator that delivers 100 mW/cm2. This intensity can be reduced, until 0.9 mW/cm2, by interposing neutral filters between the light source and the cell.
The apparatus for the measurement of the electrical characteristics is an arm with 4 tips that allows to measure simultaneously the characteristics of 4 diodes of the cell. All the measurements are automated and the calibration of the equipment is regularly verified by means of a reference silicon solar cell.
 |
 |
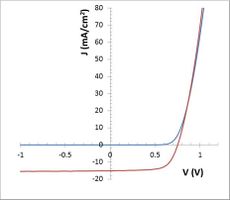 |
Fig. 1: Measurement of the I(V) characteristics under illumination |
Fig. 2: Monitoring software for the measurement of the I(V) characteristics |
Fig. 3: I(V) characteristics measured in the dark (blue curve) and under illumination (red curve) for a 12 mm2 photovoltaic cell whose donor material of the active layer is a fluorinated polymer. Photovoltaic parameters: Voc = 752 mV; Jsc = 15.1 mA/cm2; FF = 67.5%; PCE = 7.6% |
External quantum efficiency measurement
The spectral response of organic photovoltaic cells is obtained from the measurement, as a function of the wavelength, of the intensity of the incident light, the intensity of the reflected light, and the photogenerated current.
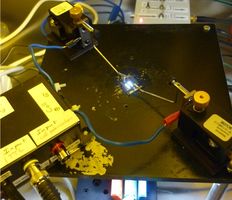
In the measurement bench of the spectral response (Fig. 4) installed in the glove box, the incident white light is first separated by a monochromator whose resolution is 5 nm for wavelengths between 350 and 1300 nm. Incident and reflected light intensities, as well as the photogenerated current, are then simultaneously registered at each wavelength. At last, these data are used to calculate the External Quantum Efficiency (EQE, Fig. 5) and to estimate the Internal Quantum Efficiency (IQE).
 |
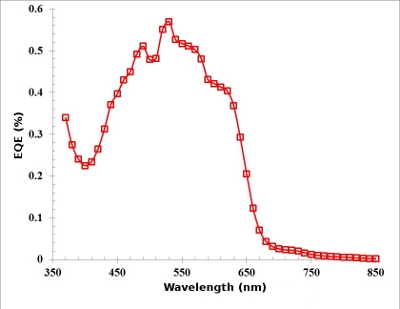 |
Fig. 4: Measurement bench of the spectral response |
Fig. 5: EQE spectrum of an organic photovoltaic cell whose active layer is a P3HT:PCBM blend |
Transient measurements
 |
A dedicated measurement bench provides transient characteristics: the Transient PhotoVoltage (TPV) and the Charge Extraction (CE).
|
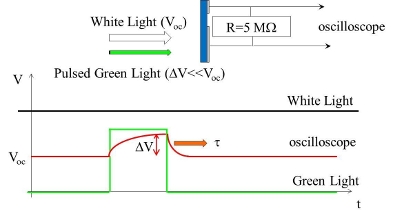
For the measurement of the TPV, the cell is first illuminated with the white ligth, used in continuous mode, and its intensity sets the open circuit voltage Voc. It is then illuminated with the green ligth to increase Voc from ΔV (Fig. 6). The return to equilibrium that follows the end of the green pulse is characterised by a time τΔn that reflects the recombination of charge carriers. In practice, this measurement is repeated for different values of the white light intensity so as to obtain the variation of τΔn according to Voc (Fig. 7).
 |
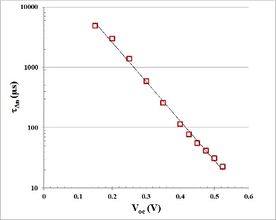 |
Fig. 6: Principle of the TPV that enables the estimation of the variation of the characteristic time of charge carriers recombination according to Voc |
Fig. 7: Variation of τΔn according to Voc for a cell whose active layer is a P3HT:PCBM blend |
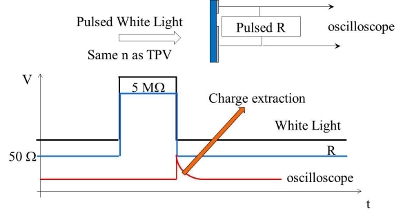
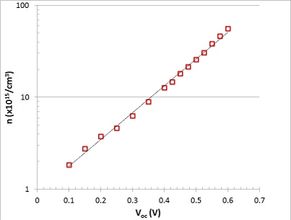
For the measurement of the CE, the cell is illuminated with the white ligth, used at the same intensity as for the TPV but in the pulsed mode. At the end of the pulse the resistance at the connections of the oscilloscope varies from 5 MΩ to 50 Ω (Fig. 8). The charge carriers concentration n depends on the open circuit voltage Voc so that, by repeating this measurement for various values of the ligth intensity, it is possible to obtain the variation of the charge carriers concentration n according to Voc (Fig. 9). The combination of TPV and CE measurements allows to obtain the variation of the characteristic time τΔn of charge carriers recombination according to their concentration n (Fig. 10). |
 |
 |
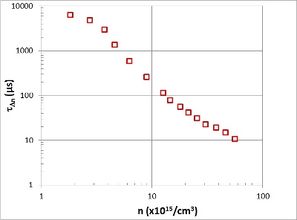 |
Fig. 9: Variation of the concentration n of charge carriers according to Voc for a cell whose active layer is a P3HT:PCBM blend |
Fig. 10: Variation of τΔn according to the concentration n of charge carriers for a cell whose active layer is a P3HT:PCBM blend |